Transforming a Vacation Rental Business from Spreadsheet Chaos to Financial Clarity
A centralized Google Sheets financial system designed so two elderly family members can actually use it.
1. Executive Summary
A small family-operated vacation rental business had been managing its finances through manually maintained spreadsheets created over several years.
While the owners consistently collected operational and financial data, the reporting structure had gradually become difficult to maintain, difficult to analyze, and increasingly vulnerable to human error. Every year, a new spreadsheet was created with slightly different logic, formulas, and categorizations. Over time, this created inconsistencies between reports and made it challenging to clearly understand the actual financial performance of the business.
Our Fractional Financial Analyst conducted a full operational and financial review of the business and designed a simplified reporting and dashboard system tailored specifically for non-technical users.


The result was a centralized Google Sheets-based financial management system that allowed the owners to:
- track bookings and revenue across multiple channels (Airbnb, Booking.com, and local channels like hutshub.com, karpaty.info, verkhovyna.life),
- monitor operational costs,
- categorize expenses consistently,
- visualize financial performance,
- and significantly reduce manual reporting complexity.
Most importantly, the system was intentionally designed to remain simple and understandable for two elderly family members actively involved in daily operations.
2. The Challenge: Years of Data Without Structure
The business had grown organically over time, but the financial tracking process had not evolved alongside it.
Several operational issues had accumulated:
- Every year used a separate spreadsheet with different formatting and structures
- Expense categories were inconsistent between reporting periods
- Revenue data from multiple booking channels was difficult to consolidate
- Financial discrepancies were difficult to identify and verify
- Manual calculations increased the risk of reporting errors
- Existing reports contained excessive information but limited actionable insights
- The system depended heavily on memory and manual interpretation
In practice, this meant the business owners spent significant time maintaining spreadsheets without gaining a clear understanding of profitability, cost dynamics, or operational performance.
Because two elderly family members were directly involved in maintaining the data, usability and clarity became just as important as technical accuracy.
The system needed to be reliable, visual, and easy to maintain without requiring accounting or technical expertise.
3. The Solution: Simplifying Financial Operations Without Losing Visibility
Our approach focused on simplifying operations while improving reporting accuracy and visibility.
Phase 1: Business & Financial Process Review
The first step involved a full review of the existing financial documentation and operational workflow.
This included:
- analyzing historical spreadsheets,
- identifying duplicated or unnecessary reporting sections,
- reviewing booking and revenue tracking methods,
- evaluating expense structures,
- identifying inconsistencies between years,
- and determining which financial metrics were actually useful for decision-making.
Rather than simply "cleaning up spreadsheets," the objective was to redesign the reporting logic around how the business actually operated.
Phase 2: Financial Structure & Categorization System
After reviewing operational patterns, we redesigned the financial structure to make ongoing reporting significantly easier.
This included:
- creating standardized expense categories,
- simplifying cost tracking workflows,
- consolidating revenue tracking across multiple booking channels,
- reducing unnecessary manual data entry,
- and introducing consistent reporting rules.
The new structure allowed the owners to quickly understand:
- where revenue was coming from,
- which cost categories were increasing,
- seasonal operational trends,
- and overall profitability dynamics.
The system was intentionally built to balance detail with usability rather than overwhelming users with accounting complexity.
Phase 3: Dashboard & Visualization Development
A centralized Google Sheets dashboard was developed to provide a clear visual overview of business performance.
The dashboard included:
- booking tracking across channels,
- monthly revenue summaries,
- operational cost tracking,
- automated calculations,
- pie charts for expense category distribution,
- and historical trend visualizations for cost dynamics.
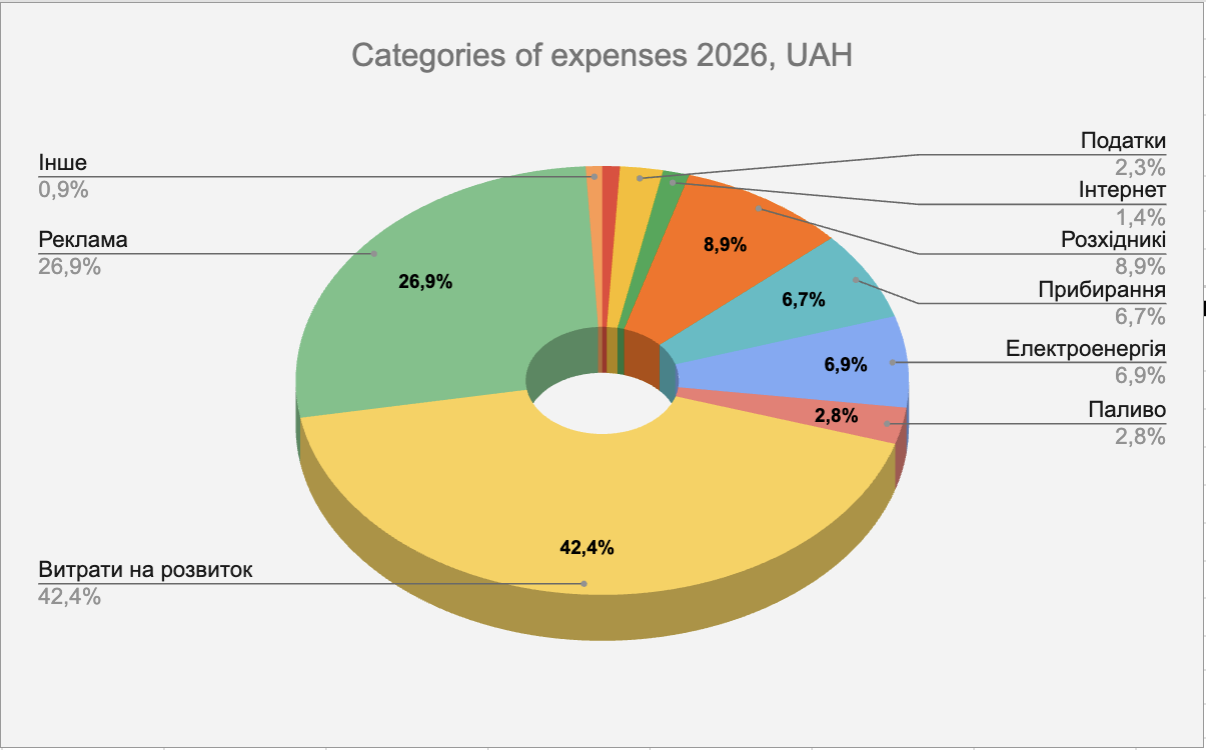
Visualization became especially important because it allowed the owners to quickly understand business performance without manually analyzing raw spreadsheet data.
The dashboard helped transform financial reporting from a "record keeping exercise" into an actual management tool.
Phase 4: Simplification for Long-Term Sustainability
One of the most important aspects of the project was usability.
The reporting system was specifically designed for daily use by non-technical users, including elderly family members actively involved in operations.
This required:
- simplifying interfaces,
- reducing unnecessary manual actions,
- minimizing formula interaction,
- improving readability,
- and creating intuitive workflows that could realistically be maintained long-term.
Instead of building an overly complex accounting system, the focus remained on creating something sustainable and practical for the business owners themselves.
4. The Results
- Consolidated fragmented yearly reporting into a centralized financial management system
- Reduced the risk of manual reporting discrepancies and formula errors
- Simplified tracking of bookings, revenue, and operational costs
- Standardized expense categorization across reporting periods
- Improved visibility into profitability and cost structure
- Created easy-to-understand dashboards with visual reporting components
- Built a system usable by non-technical and elderly family members
- Reduced time spent maintaining spreadsheets while improving financial clarity
Most importantly, the business owners gained confidence in the accuracy and usability of their financial reporting process.
5. Client Outcome
Before the project, financial tracking was mostly reactive and operational.
After implementation, the business gained:
- a clearer understanding of financial performance,
- easier operational planning,
- improved expense visibility,
- and a significantly more manageable reporting process.
The new dashboard became part of the business's daily operational workflow rather than just a document updated for bookkeeping purposes.
You can see the client's business at blue-house.travel.
6. Future Outlook
The next phase of the project may include:
- forecasting and seasonal planning tools,
- occupancy and profitability analytics,
- automated reporting summaries,
- integration with booking platforms,
- and simplified tax preparation reporting.
The foundation now exists for the business to continue growing without increasing operational reporting complexity.
Ready to Fix What's Slowing You Down?
Book a free 30-minute call. We'll diagnose the bottleneck and tell you straight whether a Sprint makes sense, no pitch, no pressure.
Average response time: 24 hours